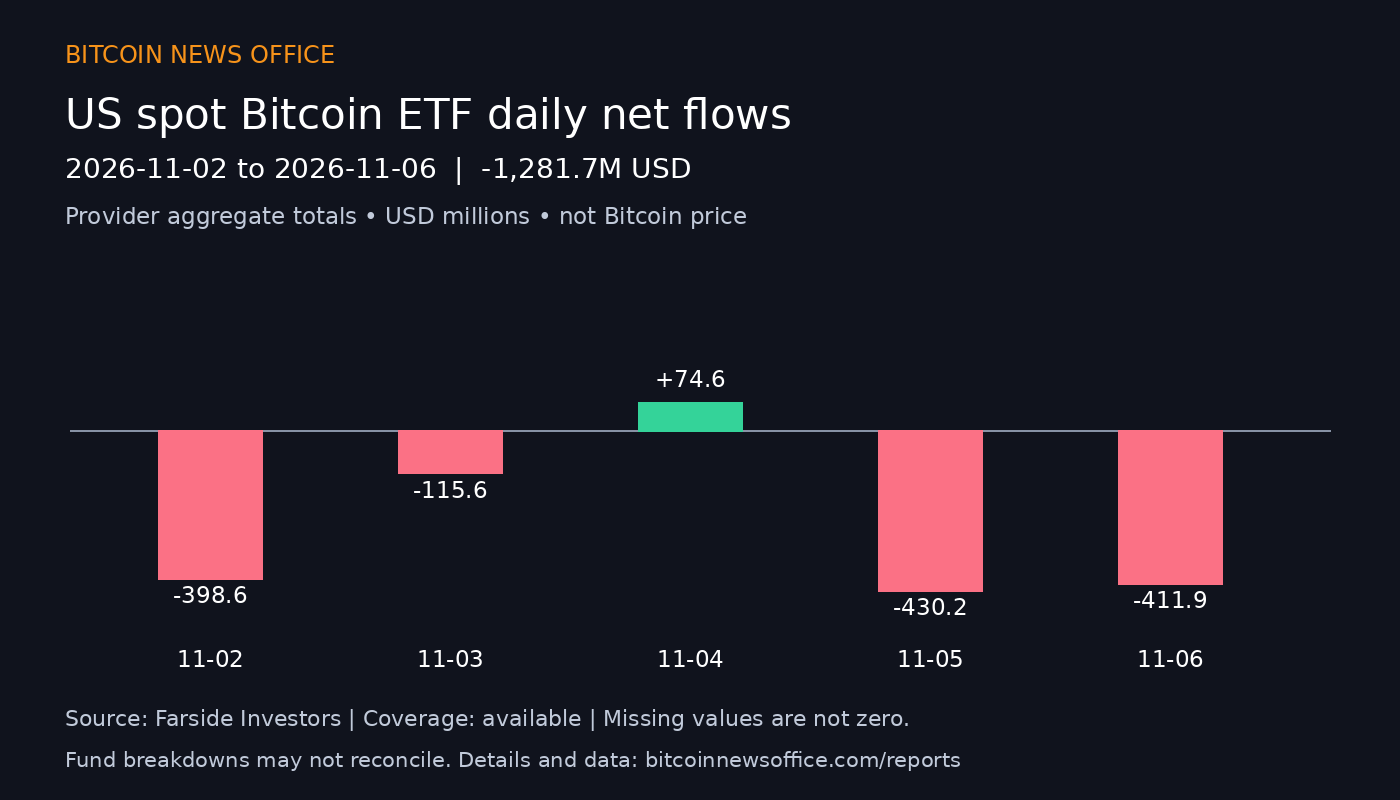
Weekly · 2026-10-26 to 2026-10-30 · −$202.4M
Provider-reported totals show $202.4M in net outflows over 5 recorded sessions; 4 positive, 1 negative and 0 flat. IBIT accounts for 31.3% of the sum of absolute fund-level net flows.
Download report archive JSONWeekly · 2026-10-19 to 2026-10-23 · +$301.2M
Provider-reported totals show $301.2M in net inflows over 5 recorded sessions; 3 positive, 2 negative and 0 flat. IBIT accounts for 64.7% of the sum of absolute fund-level net flows.
Download report archive JSONWeekly · 2026-10-12 to 2026-10-16 · −$228.4M
Provider-reported totals show $228.4M in net outflows over 5 recorded sessions; 2 positive, 3 negative and 0 flat. IBIT accounts for 67.2% of the sum of absolute fund-level net flows.
Download report archive JSONWeekly · 2026-10-05 to 2026-10-09 · −$678.9M
Provider-reported totals show $678.9M in net outflows over 5 recorded sessions; 2 positive, 3 negative and 0 flat. FBTC accounts for 53.9% of the sum of absolute fund-level net flows.
Download report archive JSONWeekly · 2026-09-28 to 2026-10-02 · +$241.1M
Provider-reported totals show $241.1M in net inflows over 5 recorded sessions; 4 positive, 1 negative and 0 flat. IBIT accounts for 57.8% of the sum of absolute fund-level net flows.
Download report archive JSONWeekly · 2026-09-21 to 2026-09-25 · +$2,385.8M
Provider-reported totals show $2,385.8M in net inflows over 5 recorded sessions; 5 positive, 0 negative and 0 flat. IBIT accounts for 48.4% of the sum of absolute fund-level net flows.
Download report archive JSONWeekly · 2026-09-14 to 2026-09-18 · +$6.1M
Provider-reported totals show $6.1M in net inflows over 5 recorded sessions; 3 positive, 2 negative and 0 flat. ARKB accounts for 33.0% of the sum of absolute fund-level net flows.
Download report archive JSONWeekly · 2026-09-07 to 2026-09-11 · −$462.7M
Provider-reported totals show $462.7M in net outflows over 4 recorded sessions; 0 positive, 4 negative and 0 flat. ARKB accounts for 46.3% of the sum of absolute fund-level net flows.
Download report archive JSONWeekly · 2026-08-31 to 2026-09-04 · +$986.7M
Provider-reported totals show $986.7M in net inflows over 5 recorded sessions; 4 positive, 1 negative and 0 flat. IBIT accounts for 59.7% of the sum of absolute fund-level net flows.
Download report archive JSONWeekly · 2026-08-24 to 2026-08-28 · +$924.5M
Provider-reported totals show $924.5M in net inflows over 5 recorded sessions; 4 positive, 1 negative and 0 flat. IBIT accounts for 72.7% of the sum of absolute fund-level net flows.
Download report archive JSONWeekly · 2026-08-17 to 2026-08-21 · +$1,917.8M
Provider-reported totals show $1,917.8M in net inflows over 5 recorded sessions; 5 positive, 0 negative and 0 flat. IBIT accounts for 68.2% of the sum of absolute fund-level net flows.
Download report archive JSONWeekly · 2026-08-10 to 2026-08-14 · −$385.2M
Provider-reported totals show $385.2M in net outflows over 5 recorded sessions; 1 positive, 4 negative and 0 flat. FBTC accounts for 27.8% of the sum of absolute fund-level net flows.
Download report archive JSONWeekly · 2026-08-03 to 2026-08-07 · +$865.3M
Provider-reported totals show $865.3M in net inflows over 5 recorded sessions; 5 positive, 0 negative and 0 flat.
Download report archive JSONWeekly · 2026-07-27 to 2026-07-31 · −$61.5M
Provider-reported totals show $61.5M in net outflows over 5 recorded sessions; 2 positive, 3 negative and 0 flat.
Download report archive JSONMonthly · 2026-09-01 to 2026-09-30 · +$2,647.7M
Provider-reported totals show $2,647.7M in net inflows over 21 recorded sessions; 13 positive, 8 negative and 0 flat. IBIT accounts for 55.4% of the sum of absolute fund-level net flows.
Download report archive JSONMonthly · 2026-08-01 to 2026-08-31 · +$3,539.1M
Provider-reported totals show $3,539.1M in net inflows over 21 recorded sessions; 16 positive, 5 negative and 0 flat.
Download report archive JSONMonthly · 2026-07-01 to 2026-07-31 · +$172.8M
Provider-reported totals show $172.8M in net inflows over 22 recorded sessions; 13 positive, 9 negative and 0 flat.
Download report archive JSONMonthly · 2026-06-01 to 2026-06-30 · −$4,509.7M
Provider-reported totals show $4,509.7M in net outflows over 21 recorded sessions; 3 positive, 18 negative and 0 flat. IBIT accounts for 72.5% of the sum of absolute fund-level net flows.
Download report archive JSONMonthly · 2026-05-01 to 2026-05-31 · −$2,406.0M
Provider-reported totals show $2,406.0M in net outflows over 20 recorded sessions; 6 positive, 14 negative and 0 flat. IBIT accounts for 55.5% of the sum of absolute fund-level net flows.
Download report archive JSONMonthly · 2026-04-01 to 2026-04-30 · +$2,021.7M
Provider-reported totals show $2,021.7M in net inflows over 21 recorded sessions; 14 positive, 7 negative and 0 flat. IBIT accounts for 67.9% of the sum of absolute fund-level net flows.
Download report archive JSONMonthly · 2026-03-01 to 2026-03-31 · +$1,315.6M
Provider-reported totals show $1,315.6M in net inflows over 22 recorded sessions; 14 positive, 8 negative and 0 flat. IBIT accounts for 75.3% of the sum of absolute fund-level net flows.
Download report archive JSONMonthly · 2026-02-01 to 2026-02-28 · −$206.6M
Provider-reported totals show $206.6M in net outflows over 19 recorded sessions; 9 positive, 10 negative and 0 flat. FBTC accounts for 26.9% of the sum of absolute fund-level net flows.
Download report archive JSONMonthly · 2026-01-01 to 2026-01-31 · −$1,604.8M
Provider-reported totals show $1,604.8M in net outflows over 20 recorded sessions; 7 positive, 13 negative and 0 flat. FBTC accounts for 49.4% of the sum of absolute fund-level net flows.
Download report archive JSONMonthly · 2025-12-01 to 2025-12-31 · −$1,092.5M
Provider-reported totals show $1,092.5M in net outflows over 22 recorded sessions; 8 positive, 14 negative and 0 flat. IBIT accounts for 37.3% of the sum of absolute fund-level net flows.
Download report archive JSONMonthly · 2025-11-01 to 2025-11-30 · −$3,466.7M
Provider-reported totals show $3,466.7M in net outflows over 19 recorded sessions; 8 positive, 11 negative and 0 flat. IBIT accounts for 66.6% of the sum of absolute fund-level net flows.
Download report archive JSONMonthly · 2025-10-01 to 2025-10-31 · +$3,424.9M
Provider-reported totals show $3,424.9M in net inflows over 23 recorded sessions; 13 positive, 10 negative and 0 flat. IBIT accounts for 77.5% of the sum of absolute fund-level net flows.
Download report archive JSON